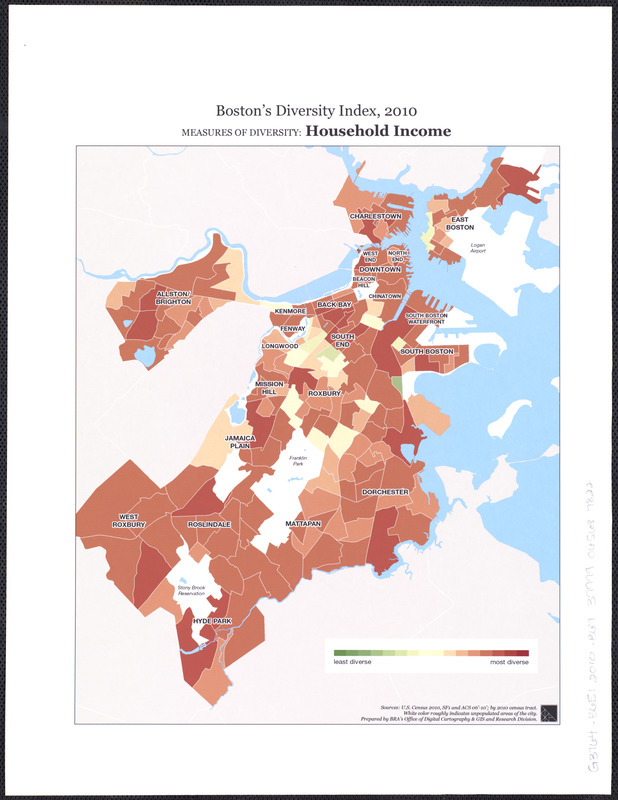
Boston's diversity index, 2010 : measures of diversity : household income
Bostons diversity index, 2010 : measures of diversity
Item Information
Title:
Boston's diversity index, 2010 : measures of diversity : household income
Description:
Another series of maps produced by the Boston Redevelopment Authority shows different measures of diversity, including race, language, age, household income, education, and region of birth. Census tracts on each map range in color from deep orange (indicating the most diverse neighborhoods) to deep green (least diverse). By comparing these various maps, it is evident that the most diverse census tracts are located in Dorchester, Roxbury, Roslindale, East Boston, and Brighton.
![Boston personal income ; Boston personal income [and] residential population density](https://bpldcassets.blob.core.windows.net/derivatives/images/commonwealth:fn107c409/image_thumbnail_300.jpg)