Erosion and Deposition around Martha's Vineyard
Item Information
- Title:
- Erosion and Deposition around Martha's Vineyard
- Description:
-
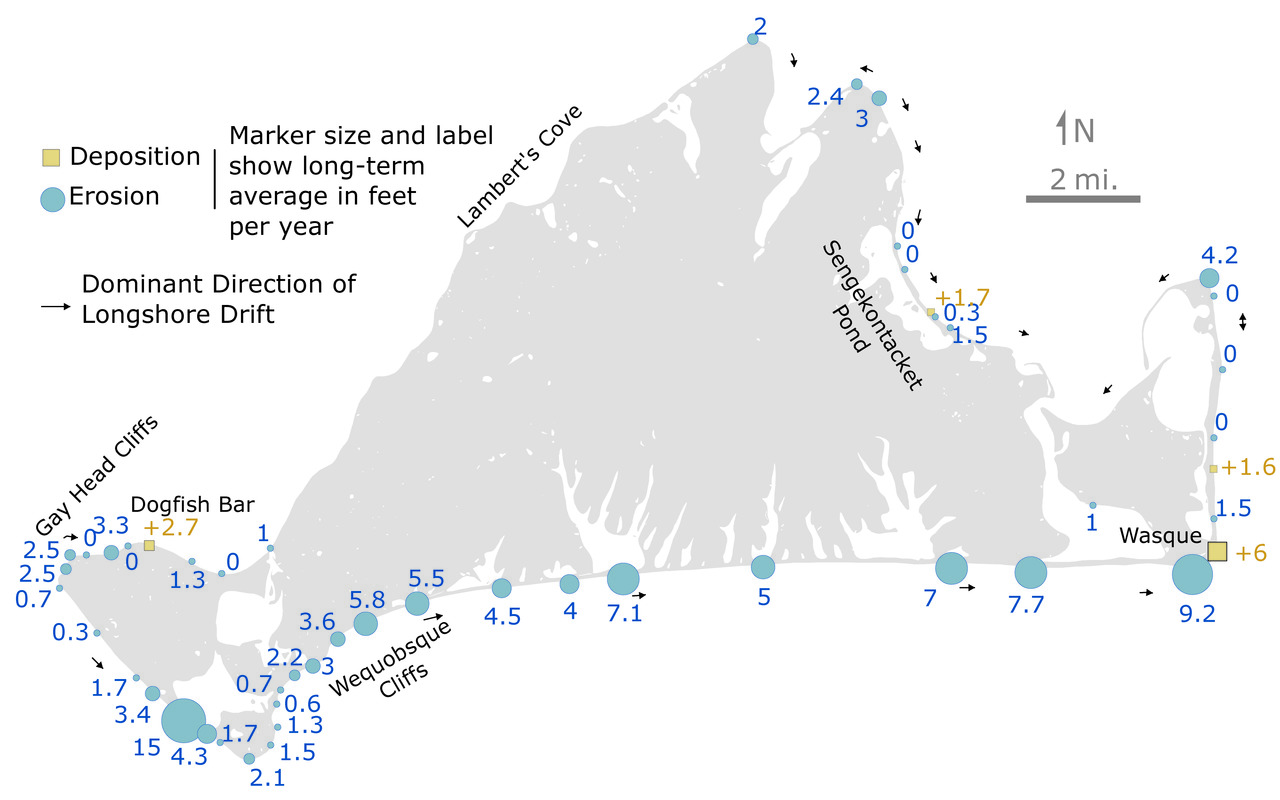
Erosion and deposition around Martha’s Vineyard based on data from Clifford Kaye’s 1973 study. The size of the bubbles indicates erosion rates (blue: negative numbers in feet per year) whereas the positive brown numbers indicate areas of deposition. Dogfish Bar, on Aquinnah’s north shore, is one area with active accretion of sand.
- Name on Item:
-
Brian R. Hall [Compiler]
- Date:
-
December 4, 2015
- Format:
-
Maps/Atlases
Objects/Artifacts
- Genre:
-
Book illustrations
- Location:
-
Harvard University
Harvard Forest Archives - Collection (local):
-
Harvard Forest Martha's Vineyard Collection
- Subjects:
-
Coastal
Regional Studies
Erosion
- Places:
-
MassachusettsDukes (county)Martha's Vineyard (island)
- Permalink:
- https://ark.digitalcommonwealth.org/ark:/50959/vh53xt73z
- Terms of Use:
-
Copyright (c) Brian R. Hall
This work is licensed for use under a Creative Commons Attribution Non-Commercial No Derivatives License (CC BY-NC-ND).